Pages

July 30, 2011

Ranking the PMs/Presidents on the basis of GDP

Floyd Norris, the Chief Financial Correspondent and a blogger on The New York Times has a very interesting analysis on G.D.P numbers in the United States (US). He states that the government has limited influence on the economy and the president can have limited influence on government policy.
He says that
Normal economic cycles mean that growth is likely to be less impressive for a president who enters office at the end of a boom, as George W. Bush did, and better for one who enters when growth is weak, as Bill Clinton and Ronald Reagan did. If normal cyclical factors return, and President Obama has a second term, his record should end up much better than it currently appears. If he loses, he could be like Gerald Ford, who also took office during a deep recession.


He also said that all the presidents except George W. Bush (Jr. Bush) and Barack Obama joining the office after World War II have done fairly well having a growth ranging from 2.2 per cent to 5.4 per cent. It is with George H. W. Bush (also called as Sr. Bush), the number started faltering. If Obama by any means gets nominated for a second term, the GDP growth may turn rosy and better than it currently appears as said by the theory of normal economic cycles. The table given below also reflects that Democratic Presidents performed better than Republican except under Reagan.

What does India’s GDP say under different Prime Ministers?
The table 2 depicts the picture which is entirely different. India boasts of multi-party system unlike in US where they are two major parties.  Post independence era, India was ruled mostly by Congress before given a break in 1977 to Janata Party, a party coming into existence after the famous Jay Prakash Aandolan. Immediately after independence under Pandit Nehru regime, the GDP grew at an average rate of 3.8 per cent which decreased marginally to 3.6 per cent under Mrs. Gandhi’s regime. Janata Party, a non-congress government came into ruling under Morarji Desai and didn’t disappoint the country. They delivered 6.5 per cent on an average before faltering to -5.2 per cent under Charan Singh regime. This is the first and only PM’s tenure in which India showed a negative GDP growth. Congress and Janata Dal swiftly changed powers and scored an average GDP score ranging from a low of 5.2 per cent to a high of 6.1 per cent.


Narasimha Rao government could not get much benefit after opening of Indian economy and could not score well in terms of numbers. The number nosedived further to 5.2 per cent. Janata Dal came to power for a short tenure and gave a comfortable growth of 8 per cent but faltered again to 4.3 per cent under H D Deve Gowda. Bhartiya Janta Party, a reformed version of Janata Party delivered an average GDP figure of 5.9 per cent. At the end of his tenure, the country GDP went as high as 10 per cent as he rationalized many reforms in the country. Dr. Manmohan Singh, the current Prime Minister and the then Finance Minister when India opened its economy scored an impressive figure of 8.6 per cent. However, India also witnessed many scandals and high level corruptions under his tenure, causing the country’s exchequer a loss of billions of dollars.
Overall, on an average, Congress gave an average GDP figure of 4.91 per cent during their tenures while non-Congress governments gave an average GDP figure of 4.42 per cent.
In India, the strong consumption story and Next’s Trillion Dollar opportunity has worked really well in recent years which helped Congress a lot. However, the figures also worsened in terms of increased deficits and borrowings as the government went for high spending on social measures schemes. Though interest rates are less now in comparison to 90s, the high interest rates (real  saving interest rate) are decelerating the growth and affecting the overall buildup of India a lot.
Hope we will get the best out of it and India will bounce back!

Happy Investing!

-          Amar Ranu


July 29, 2011

First Quarter Review of Monetary Policy 2011-12 - RBI stumps with 50-bps hike; Inflation target hiked to 7%

The RBI revealed its super hawkish monetary policy for the first quarter 2011-12 by raising the policy repo rate under the liquidity adjustment facility (LAF) by 50 bps.  The repo rate will now move to 8 per cent. This is 11th successive hike since Mar 2010 and the fastest monetary accommodative uncovering in the world. Consequently, the reverse repo rate under the LAF, at a spread of repo rate minus 100 bps gets adjusted to 7 per cent. Similarly, the Marginal Standing Facility (MSF), determined at a spread of 100 bps above the repo rate will move up to 9 per cent.

Repo rate is the rate at which RBI lends to banks and Reverse repo rate is the rate at which RBI borrows from banks. The new term Marginal Standing Facility (MSF) is the additional borrowing window for banks set up at 100 bps above repo rate and they can borrow overnight up to one per cent of their respective Net Demand and Time Liabilities (NDTL).

July 28, 2011

SEBI Regulations - A cup of half-emply, half-filled

The SEBI board in its today meeting announced major decisions which are as mentioned below:

a)      Fees on Mutual Fund transactions: Healing the wounds of Mutual Fund Industry which had been almost killed since the ban of entry load in Aug 2009, SEBI imposed a fee of Rs. 100 per transaction on Mutual Fund investments for existing investors while new investors would have to cough up Rs. 150 on investment above Rs. 10,000. This is a break through decision for bleeding distributors’ community to compensate them to penetrate into retail segment.
The per transaction fee would be Rs. 100 for investments above Rs. 10,000 including Rs. 50 per new folio creation i.e. first time Mutual Fund investor. This may be deterrent to investors as distributors may promote new folio each time investors put money into Mutual Funds. For SIPs, the transaction charges can be recovered in 3 or 4 months. However, it is still not clear whether the new SIP transactions of less than Rs. 10,000 would have one-time fee of Rs. 150 only recoverable on 3 or 4 months. Investors investing directly through AMCs shall not require paying any transaction fee or folio creation fee.
This move is seen as back door imposition of entry load in Mutual Fund which has been banned in Aug 2009. The ruling had hit Mutual Fund inflows severely and had de-incentivized IFAs and distributors to promote Mutual Funds.  
The regulator also put onus on AMCs to do due diligence and regulate distributors alternatively. The diligence process would be applicable for those distributors satisfying one or more of the following criteria:
1)      Multiple point presence in more than 20 locations
2)      AUM raised over Rs. 100  crore across industry in the non-institutional category but high networth individuals (HNIs)
3)      Commission received of over Rs. 1 crore p.a. across industry
4)      Commission received of over Rs. 50 lakh from a single mutual fund

b)      New Takeover regulation: The regulator raised the initial trigger threshold to 25 per cent from the existing 15 per cent and also abolished the non-compete fees. All shareholders would be given exit at the same price. It also increased the minimum offer size from the existing 20 per cent of the total issued capital to 26 per cent of the total issued capital. This is a welcome move for institutional investors who were not able to put money in listed companies for more than 15 per cent of their issued capital in fear of mandatory requirement of additional 20 per cent open offer. Now, investors can buy up to 25 per cent stake without making an open offer.

c)       Guidelines for Infrastructure Debt Funds (IDF): The SEBI also allowed existing Mutual Funds to set up IDF. Existing companies in infrastructure financing for a period not less than five years can also set up Mutual Funds exclusively for the purpose of launching IDF scheme. As said in earlier document by the Finance Ministry, it would invest 90 per cent of its assets in the debt securities of infrastructure companies or SPVs across all infrastructure sectors. This new proposal may open a new financing window for the government who has been looking for a fund equivalent to $ 1 trillion to build the infrastructure in India.

d)      Reduction in no. of pages of IPO form: The SEBI allowed an approximate 50 per cent reduction in number of pages and asked for standardization of form and a single form for ASBA/Non-ASBA. It has also asked to put track record of lead managers in Bid-cum-Application Form and Abridged Prospectus. This would a boon for all investors who have to go through the pain of filling so many information in a larger sized form. 

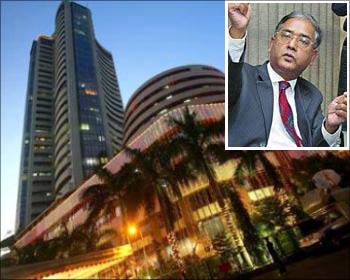
The SEBI also announced various other regulations and guidelines related to simplifying and rationalizing trading account opening process and also harmonized the new KYC applicable for all transactions. The guidelines have been framed keeping the investors at benefit. Under former SEBI C B Bhave’s chairmanship, there had been a number of investors’ friendly steps but too many guidelines had been killing the industry especially Mutual Fund industry. The new chairman U K Sinha, an IAS veteran and the former Chairman of UTI Mutual Fund had promised some incentives to distributors/IFAs to sell Mutual Funds which to a large extent seemed justified in today guidelines. However, at the end, investors would be paying some additional charges on their Mutual Fund investments.

Happy Investing!
-         Amar Ranu

July 14, 2011

Mutual Funds’ Net Assets dwindled in June; Equity saw a marginal inflow

After seeing few positives in recent months, Equity saw a good dip in net inflow in the month of June. The net inflows in Equity Mutual Funds dwindled to Rs. 20 crore in June 2011 from Rs. 1,546 crore in May 2011. This is the massive fall in inflows in Equity in recent months.
The uncertain domestic equity market coupled with the bleak global factors predominantly emanating from Euro region also caused Indian investors to redeem their investments out of Equity Mutual Funds and allocate to fixed income products. The domestic equity market remained in bear mood in most of trading days in June before given a boost by FIIs in the last week; thus, letting the broader indices Sensex and Nifty 50 to end in positive.
In addition, the overall Mutual Fund assets fell to Rs. 673,176 crore in June 2011 from Rs. 731,448 crore in May 2011, a fall of Rs. 58,272 crore or 7.97 per cent. Also, the industry saw a total outflow of Rs. 62,442 crore which was mainly caused by outflows in short term debt category – Liquid Funds and Ultra Short Term Funds. In total, these two categories had an outflow of Rs. 62,378 crore. Other categories which saw a net outflow are Gilt (Rs. 88 crore), ELSS (Rs. 80 crore), FOF Investing Overseas (Rs. 42 crore) and Other ETFs (Rs. 210 Crore). Only Balanced Fund, Equity Fund and Gold ETF categories saw a net inflow of Rs. 84 crore, Rs. 20 crore and Rs. 252 crore respectively.
Banks continue to reduce their investments in Mutual Funds; as on June 17, 2011, the net investments stand at Rs. 84,034 crore from over Rs. 1 lakh crore on May 20, 2011. Recently, the RBI has instructed all banks to cap their investments in Mutual Funds up to 10 per cent of their net worth as on Mar 31, 2011. Earlier, the deadline had been as on Oct 2011 which has been extended by another six months. It is being expected that investments worth Rs. 50,000-55,000 crore would flow out of the system in next six months.


Net Outflows in June 2011
The outflows continued in June 2011; barring categories like Equity, Balanced and Gold ETFs, all other categories saw a net outflow. The equity category saw a net inflow of Rs. 20 crore on standalone basis; however, if we consolidate Equity with Balances and ELSS, there has been a net outflow in totality.
On net asset basis, the MF industry AUM also came down to Rs. 673,176 crore, a fall of 7.97 per cent. The other categories which saw a major fall in assets are Liquid/Money Market (-22.36 per cent), Other ETFs (-8.25 per cent), FOF Investing Overseas (-6.2 per cent), Income (-5.49 per cent), Balanced (-4.45 per cent) and others.

Gold ETF continues to see inflow and increase in AUM too. In last 26 months, it did not see any outflow except at one occasion when it saw a marginal outflow of Rs. 6 crore. In totality, it saw a total inflow of Rs. 4,000 crore in last 26 months. In June 2011, it saw a total inflow of Rs. 252 crore; also its net assets increased to Rs. 5,568 crore in June 2011 from Rs. 5,463 crore in May 2011. 

FMPs still rule the inflows
We continue seeing new FMPs in the street. A total of 74 FMPs has been launched collecting a total AUM of Rs. 7,747 crore. The new fund house Union KBC Mutual Fund launched its maiden Equity Fund, Union KBC Equity Fund which collected a total AUM of Rs. 167 crore. It also launched a liquid fund, Union KBC Liquid Fund.

Happy Reading!

- Amar Ranu

July 7, 2011

RBI’s Policymaking – Is the transmission happening?

Post Lehman Crisis, the world scenario changed drastically forcing many nations to follow the accommodative measures so as to ease the liquidity deficit in the financial system. India, too, remained coupled to global events and remained unscathed from a global slowdown because of its increased integration with the global economy.

In India, the Central Bank, Reserve Bank of India took a series of accommodative measures to support the economy. Soon, the world scenario changed with confidence winning and improved numbers. However, the ease of liquidity put pressure on pricing which led to burgeoning of inflation. In real practice, India’s economy gets driven by two factors – first, domestic consumption story which, in recent years, improved on account of increased purchasing power due to various government sponsored initiatives and other factors and second, direct government aids to different sectors/industries in the form of duty cuts or other aids. The multiple factors also put pressure on inflation which also got imported, thanks to high commodity prices including crude oil, to a certain extent due to our large dependency on them.


In series of steps, the RBI hiked policy rates ten times successively, effectively by a total of 425 points since Mar 2010 in order to tame inflation which had been due to structural reasons too. Every time, RBI raises policy rates, it remains firm in taming the inflation which has become a toy of political storm too.

To support the fast transmission of policymaking, the central bank also made some changes in policy decisions – (1) introduction of base rate (2) the new Marginal Standing Facility (MSF) to support additional lending (3) restrictions on cross-lending between banks and mutual funds which have been rampant till some time ago. However, the RBI expressed its annoyance over the quality of data on which they have been operating the monetary policy. No doubt, the transmission of monetary policy has improved and to a large extent, the hiking of rates have slowed down the demand and also affected the economy growth, thanks to increased interest rates which have raised the average cost of capital. It has affected the capex investment too. In recent times, the RBI questioned the quality of data on Index of Industrial Production (IIP) which measures the industrial growth and Wholesale Price Index (WPI) which is also called as Headline Inflation; these data do not reflect the real economic activity. Volatility still persists in IIP and WPI. Even the recent improvements in IIP and WPI as per 2004-05 series have not helped the central bank; the data get revised by a wider spread on subsequent months. As evident, even the 10 rate hikes, one after another in the past 15 months have not dampened the demand effectively. In the last 2 years, economic forecasts from all government institutions, from Central Statistical Organisation (CSO) to RBI to Planning Commission have been questioned as they turned inaccurate. The high fiscal deficit and continuous gilt supply also kept RBI at bay in effective transmission of monetary policy.


Does it say RBI has failed?
Not really! In the past, RBI had been instrumental in taking the country out of the century worst financial crisis; so, it won’t be good to comment on their effectiveness. Their hands are also tied in terms of data availability, political interference (though it is said that RBI is not under the government interference but not in real sense) and dynamic nature of the situation. The various structural issues including supply-related factors also waned the effectiveness of policy transmission. The persistently high food inflation in the last two years has migrated to manufacturing inflation too.

The RBI says that they are handicapped by the reliability of some of the basic data that they need to use in policy calculations which remains true to a large extent. In a nut-shell, India’s inflation must drop before it eats the economy; hope the government must be listening to improve the effectiveness of policy making which are indirectly linked to them.

Happy Reading!

-          Amar Ranu

July 2, 2011

FIIs’ rave party in India; Economic indicators are at loggerheads

From bleak to bright – the markets suddenly turned positive ending its successive falls, thanks to strong FIIs inflows and short covering. In a swift movement, the bellwether Sensex added over 1300 points in a span of nine working days ending all the bearish sentiments which had been prevalent across the punters. The favorable factors emanating were from Greece whose parliament approved stark austerity measures; thus, paved the way for international financial aid and it would bail out the country. In India, FIIs joined in the rave party after a brief lull with a total inflow of Rs. 5,084 crore in the last week of June. Markets across the world moved up.

What the other indicators say?
While the equity moved up on favorable news emanating from European sub-region, the manufacturing has slackened across the world. In the latest Purchasing Managers’ Index (PMI) by HSBC and Markit Economics, the figures dropped across the countries. As per the latest figures, the manufacturing growth is slowing from China to Europe, thus, sending the dilemma to all central bankers whether to increase the interest rates to combat inflation despite high prices. While China’s factory index fell to its lowest level since Feb 2009, Europe’s index dropped to 18-month low. Across Europe i.e. Italy, Ireland, Spain, Greece, Germany and others reported contraction. The UK also reported a fall in PMI in June. In India too, manufacturing growth loses steam in June 2011. The PMI drops two per cent to 55.3 per cent in June, its lowest level since Sept 2010. The PMI is considered a good indicator of manufacturing activity across the world, but in India, the large contribution from the unorganized sector yields a low correlation with industrial growth.

Why PMIs are falling?
In the state of higher interest rates, central banks are tightening the interest rates, thus, hurting the economic growth. The average cost of borrowing has increased which are hurting the investment. In India, the investment growth in the latest GDP growth has grown flat. Gross fixed capital formation for Q4FY11 stood at 0.4 per cent compared to 7.8 per cent and 8.6 per cent in Q3FY11 and FY 2011 respectively.

Market punters are blaming the global economic scenario for the current headwinds. But the tailwinds still exist. We expect that the domestic companies’ performances in the first quarter of FY 12 would also decide the movement of markets as the internal consumption growth story remains intact. The natural historical corrections are also certain and the future looks promising. So, let us be hopeful.

Happy Investing!
-          Amar Ranu