Highlights:
• The bonds remained jittery throughout the week; however, it settled down at low levels as compared to last week closures.
• The Industrial Output Data as measured by Index of Industrial Production (IIP) rose a more-than expected 13.8 per cent in July 2010, or nearly twice the 7.2 per cent seen in last month.
• Retail Inflation and Food Inflation rose over 15 per cent and 11 per cent, causing a concern for RBI which may hike the rates again.
• The market liquidity remained comfortable with the net absorption of Rs. 27,640 crore under LAF window. However, it would remain in deficit mode going forward.
• The market speculation that the current benchmark paper will be replaced have been put on hold after a Senior Finance Ministry official stated that there is adequate headroom in the current 10-year paper and the bond is expected to last for the entire borrowing in FY11.
View & Recommendations:
• The unexpected factory output at 13.8 per cent plus the high inflation figures may prompt the central bank RBI to revise the policy rates upwards. However, the market has already factored into the 25-bps hike in policy rates.
• Bond yields may soften further in view of global economic environment especially from US i.e. better than expected US Employment data.
• The absence of debt sale in the coming week will keep the demand for debt papers high. The real tone will be set after the mid-quarter policy review this week. Any positive surprise will be greeted with a rally in bond prices. The market is likely to focus on domestic data and policy measures. The policy meet will also review the awaited headline inflation figure due on Sept 14, 2010.
Broader Perspectives:
Bond Front
It is concerned that policy makers are running out of ammunition to control inflation and high factory output is also reigning in strongly; the RBI may go for an upward hike in policy rates. However, the mixed sentiments emanating from global markets are preventing RBI from taking any extreme measures. US President Barack Obama commented that US economy was taking longer than expected time to recover from economic shivers. However, the better-than-expected growth in US employment increased the odds of a fifth interest-rate hike this year.
Bond prices moved up with the 10-year benchmark yield witnessing a drop of 7 bps. The benchmark bond 7.80% 2020 yield nosedived from 7.98 per cent to 7.91 per cent. The comment by the Senior Finance Ministry over the continuance of the current 10-year benchmark bond for the remaining fiscal year 2010-11 boosted the sentiments among traders and investors which lapped the bond to make the prices attractive. He added that the government's preference was to borrow through papers of longer maturity, in order to evenly spread out its outstanding. However, the 8.13% G-Sec 2020 eased only 1 bps to 8.04 per cent. The G-Sec volume was also strong as reported in NDS-OM platform; it showed a daily average of Rs. 12,353 crore over the week. The 1-10 year spread also reported a sharp drop from 168 bps to 149 bps.
Bond Supply
The government auctioned securities worth Rs. 11,000 crore last week. The bonds auctioned were the 7.17% 2015 for Rs. 4,000 crore, the 8.13% 2022 for Rs. 4,000 crore and the 8.26% 2027 for Rs. 3,000 crore respectively. The cut-offs were in line with the market expectations which came in at 7.69 per cent, 8.02 per cent and 8.35 per cent. Five State Governments namely Maharashtra, Punjab, Tamil Nadu, Uttar Pradesh and West Bengal conducted the auction of their State Development Loans for combined amount of Rs. 5,300 crore on Sept 07, 2010. Their cut-off yields were in the range of 8.29 per cent to 8.41 per cent.
Liquidity
The liquidity was comfortable throughout the week as measured by bids for Repo and Reverse Repo auctions in Liquidity Adjustment Facility (LAF). The net absorption amount was Rs. 27,640 crore for this week. This week, there won’t be any auction which will ease off the liquidity. However, the advance tax outflow to the tune of Rs. 50,000 will put the liquidity in deficit mode. The average Call and CBLO rates dropped to 4.65 per cent and 4.28 per cent from 4.77 per cent and 4.75 per cent respectively over the week.
Corporate Bonds
Corporate bonds’ yields fell over the week. The 10-year AAA bond ended at a yield of around 8.71 per cent compared to 8.75 per cent. However, the 1-year bond hardened by 15 bps to 7.95 per cent from 7.80 per cent a week earlier. In the primary market, EXIM Bank raised Rs. 100 crore with 5-year paper and another Rs. 100 crore with 10-year paper with an annualized yield of 8.45 per cent and 8.68 per cent.
September 13, 2010
September 2, 2010
IRDA regulations – Policyholders to be benefitted
The recent spat between IRDA, the Insurance Regulator and SEBI, the Capital Market Regulator created an outcry in the market with each party holding its supremacy over the much sought and widely circulated insurance product, Unit Linked Insurance Products (ULIPs) in India. The Government of India in quick solution passed an ordinance to support the IRDA regulation over ULIPs ending the market speculation that SEBI might make Ulips in line with Mutual Funds.
Fresh from its victory in the regulatory turf war over ULIPs, the IRDA announced a set of regulations. With the expansion of insurance sector and more innovative insurance products, particularly Unit Linked Insurance Products (ULIPs) entering into Life Insurance products list, IRDA has been sensitive to the changing scenario. In the past, IRDA has come out with various steps to bring in changes in the regulatory framework to address various concerns of the policyholders.
IRDA in a note stipulated that insurers must provide the prospect/policyholder all relevant information regarding amounts deducted towards various charges for each policy year so that the prospect could take an informed decision. IRDA also raised the concerns of mis-selling and Distance Marketing which require guidelines from the insurance regulator. Further, IRDA set up an exclusive Customer Affairs Department that focuses on consumer related issues and initiatives including grievance redressal and consumer education through Insurance Awareness Campaigns. It is perhaps the most important step in the interests of policyholders.
Recent Regulatory Proposals
ULIPs are hybrid instruments that combine elements of mutual funds and insurance. In most cases, the insurance amount is capped to 5-times of initial insurance premium. Recently, IRDA came out with guidelines governing ULIPs – how such products are sold/bought; how ULIPs can be better financial instruments for providing risk coverage and many more. Some of the ULIPs related regulations are as given below:
1) Level Paying Premium
All regular premium /limited premium ULIPs shall have uniform/level playing premiums. Any additional payments shall be treated as single premium for the purpose of insurance cover.
2) Compulsory Cover
Currently there are a number of ULIPs schemes where there is maximum insurance cover up to five times of the premium paid or no insurance cover. Now it has been recommended that the life insurance component has to be at least 10 times the premium paid for policies up to 10 years and at least 1.05 times the annual premium for policies of 20 years and above.
3) Lock in Period increased to Five Years
IRDA has increased the lock-in period for all ULIPs from three years to five years, including top-up premiums, thereby making them long term financial instruments which basically provide risk protection.
4) Minimum Premium Paying term of Five Years
All limited premium ULIPs, other than single premium products shall have premium paying term of at least five years
5) Even Distribution of Charges
Charges on ULIPs are mandated to be evenly distributed during the lock-in period, to ensure that high front ending of expenses is eliminated.
6) Pension Plans to have Guaranteed Return
As regards pension products, all ULIP pension/annuity products shall offer a minimum guaranteed return of 4.5% per annum or as specified by IRDA from time to time. This will protect the life time savings for the pensioners, from any adverse fluctuations at the time of maturity.
7) Rationalization of Cap on Charges
With a view to smoothen the cap on charges, the capping has been rationalized to ensure that the difference in yield is capped from the 5th onwards. This will not only reduce the overall charges on these products, but also smoothen the charge structure for the policyholder.
Though these regulations have been rolled out for the benefit of common policyholders, the insurers will have a level playing field with other players and will benefit in the long run.
September 1, 2010
Yields to fall – Focus on Income Funds
Inflation has started coming down. WPI, the official figure for measure of Inflation came down to 9.97 per cent, 0.03 per cent shy of two digits. The RBI concern on ballooned inflation, a shift of focus from growth to inflation led to a series of monetary policy measures this year, already four times witnessed. More worrisome is the fact that the inflation is no longer food prices driven; in fact it has become more generalized. Non-food inflation has risen from almost zero level in Nov 2009 to 10.9 per cent in June 2010, contribution 70 per cent to inflation.
The bond yields rose abruptly in India, however, the bond yields came down globally. For the first time in its history, the 10-year Indian and US bond yields are facing a divergent state.

The G-Sec markets witnessed hardening of yields in July and Aug 2010. The 10-year G-Sec Bond and Short Term Bonds’ yields have spiked in the recent past; which we believe that they may go up further projected the advance tax outflows in Mid September. The short term yields (1-year CD and CP) have already spiked by 200 bps in the last 3 months. The benchmark bond 7.80 per cent 2020 has already touched 8.08 per cent, currently hovering at 8.03%. It touched its four months high since May 2010. The RBI is still not comfortable with the inflation figures and the market opines that it may go with further rate hikes in the upcoming Monetary Policy meet due in mid-Sept.
We believe that the G-Sec yields in long term will follow its logical course of softening. The reasons are:
• Softening of inflation in coming months
• Improvement in Government revenues in the form of improved tax inflows, 3G and WIMAX auctions
• Reduction in fiscal deficit, if the excess revenue is used efficiently
• Spread in the Repo rate and 10-year G-Sec rate (already at multiple year high) should reduce
• Liquidity is bound to improve; temporarily we might witness liquidity deficiency in the system
• For the first time since 2002, interest rates in India are divergent to US yields (Check the above table)
Since US government continues to follow an expansionary monetary policy to revive growth, the Fed has kept its interest rates abysmal low for another extended period. However, in India, RBI has shifted its focus from good GDP/IIP growth to inflation management; therefore, we witnessed tightening of monetary policy. When inflation comes under control over next few months, bond yields (long dated bonds) will follow its logical course of softening. For those seeking to ride the yield curve at the longer end which could potentially ease in the 2nd half, we would recommend allocations to Income Fund having high average maturity. In the above stated scenario, the income funds stand to benefit with a time horizon of 12 to 18 months.
August 10, 2010
Equity outflows continue; industry added Rs. 31,654 crore
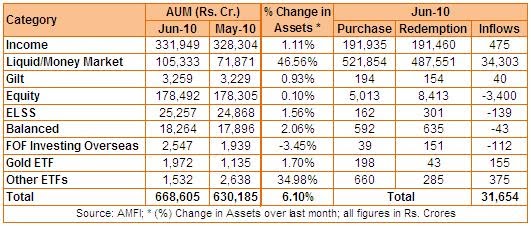
Mutual Fund industry saw a temporary relief after witnessing outflows in last two months consecutively. In July 2010, the industry saw a net inflow of Rs. 31,654 crore to its kitty mainly on account of net inflow of Rs. 34,303 crore in Liquid/Money Market category. On the other hand, the total AUM increased to Rs. 6.68 lakh crore, a rise of Rs. 38,420 crore or 6.10 per cent over the last month figure. All categories except FOF Investing Overseas reported an increase in its net AUM. While Income Funds comprising 50 per cent of total AUM reported a meager increase of 1.11 per cent in its AUM, Liquid/Money Market Fund category reported an increase of 46.56 per cent. The latest AUM figures for Income and Liquid/Money Market Fund stand at Rs. 3,31,949 crore and Rs. 1,05,333 crore respectively. The Other ETFs category shows a dramatic increase in AUM after Motilal Oswal Mutual Fund successfully closed its maiden fundamentally modified ETF MOSt Shares M50 with a total AUM of Rs. 236 crore. It has a total AUM of Rs. 1,532 crore, an increase of Rs. 397 crore other its last month figure. The Diversified Equity category showed a negligible increase of 0.10 per cent to Rs. 1,78,492 crore. Other categories too moved up albeit marginally.
The Equity Diversified Fund category saw a major redemption having a total outflow of Rs. 8,413 crore against an inflow of Rs. 5,013 crore, thus, a net redemption of Rs. 3,400 crore. The equity markets have already touched their February 2008 level and investors have become cautious of overheat going in the equity market as they fear a correction from this level. Moreover, some investors who were sitting at their investment since 2007 had also redeemed their money. Hence mutual funds booked profit to meet investors’ redemption pressures. As per the latest SEBI figures, Mutual Funds had net sale of Rs. 4,405 crore in July 2010.
The Liquid/Money Market saw the maximum inflow of Rs. 34,303 crore mainly on account of switch outs from Income/Ultra Short Term Funds to Liquid Funds. After the introduction of new MTM ruling on debt securities having average maturities more than 91 days, the Ultra Short Term Funds were the worst hit. Corporate fears that it will bring volatility to the funds which will bring down the returns. They eventually shifted to Liquid Funds or redeemed their investments. The Income category saw a net inflow of Rs. 475 crore only.
In other categories, ELSS saw a new outflow of Rs. 139 entering into fourth month having outflows consecutively month-on-month. Balanced Funds too saw an outflow of Rs. 43 crore continuing its last month losing streak. However, the industry has been witnessing a major shift since last few months from active funds to passive funds. ETFs which cater to passive funds category have seen a substantial increase in inflows. The Gold ETF and other ETFs category added Rs. 155 crore and Rs. 375 crore respectively.
The month also saw the launch of 7 open-ended NFOs and 15 close-ended NFOs (mainly FMPs). The 15 close-ended income funds collected Rs. 2,444 crore from the market while the 3 open-ended close ended funds collected Rs. 840 crore. The income category NFOs were Axis Income Saver, Canara Robeco InDiGo Fund and Peerless Income Plus Fund. The 2 open-ended Equity NFOs, mainly Mirae Asset Emerging Bluechip Fund and SBI PSU Fund collected a total of Rs. 705 crore. In other ETFs category, Motilal Oswal MOSt Shares M50 ETF collected Rs. 236 crore in its maiden NFO.
The Equity Diversified Fund category saw a major redemption having a total outflow of Rs. 8,413 crore against an inflow of Rs. 5,013 crore, thus, a net redemption of Rs. 3,400 crore. The equity markets have already touched their February 2008 level and investors have become cautious of overheat going in the equity market as they fear a correction from this level. Moreover, some investors who were sitting at their investment since 2007 had also redeemed their money. Hence mutual funds booked profit to meet investors’ redemption pressures. As per the latest SEBI figures, Mutual Funds had net sale of Rs. 4,405 crore in July 2010.
 |
| Table: Mutual Fund Asset Growth |
In other categories, ELSS saw a new outflow of Rs. 139 entering into fourth month having outflows consecutively month-on-month. Balanced Funds too saw an outflow of Rs. 43 crore continuing its last month losing streak. However, the industry has been witnessing a major shift since last few months from active funds to passive funds. ETFs which cater to passive funds category have seen a substantial increase in inflows. The Gold ETF and other ETFs category added Rs. 155 crore and Rs. 375 crore respectively.
The month also saw the launch of 7 open-ended NFOs and 15 close-ended NFOs (mainly FMPs). The 15 close-ended income funds collected Rs. 2,444 crore from the market while the 3 open-ended close ended funds collected Rs. 840 crore. The income category NFOs were Axis Income Saver, Canara Robeco InDiGo Fund and Peerless Income Plus Fund. The 2 open-ended Equity NFOs, mainly Mirae Asset Emerging Bluechip Fund and SBI PSU Fund collected a total of Rs. 705 crore. In other ETFs category, Motilal Oswal MOSt Shares M50 ETF collected Rs. 236 crore in its maiden NFO.
Source: MOSL Mutual Fund Desk
July 9, 2010
Exchange Traded Funds (ETFs) Innovations – MOSt Shares M50 ETF
Global Journey
ETFs have travelled a long distance since its inception in 1993 in USA. It took 7 years (from 1993 – 2000) to get it widely accepted among investors. Once it drew attention from investors, it grew leap and bound; the global ETF assets has reached an all time high of US $ 1.03 trillion as on March 2010 from an estimated US $ 463 million in 1993, clocking a CAGR of 56 per cent. On US Exchanges, 11 out of top 25 volume leaders/stocks are ETFs. Some of the top volume leader ETFs is SPDRs, iShares MSCI Brazil Index, Ultra Short Russel2000 ProShares, etc. These ETFs account for 78 per cent of total volume out of top 25 traded stocks on US Stock Exchanges. It was less than 25 per cent 10 years back.
Indian Journey
Not very old in India, ETFs started its journey in 2001 after Benchmark AMC forayed into this unique proposition. Since then, the ETFs grew by leap and bound. The domestic ETF assets grew from Rs. 7 crore in 2001 to Rs. 3,203 crore as on May 31, 2010. However, the main course of action in ETFs got intensified in the recent bull period. Indian equities component of Global Emerging Markets ETFs account for US $ 5.5 billion of AUM while the domestic equity ETFs now account for US $ 0.5 billion. Overall, over the past year, around 20 per cent of the net inflows into the Indian market have come from ETFs, thereby, ETFs a very significant component of Indian fund flows.
Is ETFs good for investors?
The global historical data suggests that the fund managers have not been able to beat the benchmarks constantly over a longer period. In efficient market scenario, the active funds find difficulty in beating their benchmarks. So, it is always preferable for investors to look for a product which provide a decent return, at least comparable to its benchmark with bounty of other benefits such as tax efficiency, low expense ratios.
ETFs are pools of stocks, bonds or in a few instances other types of investments such as Gold that you can trade like stocks. ETFs tend to have very low annual expenses – much lower than the actively managed funds. Moreover, ETFs are high tax efficient i.e. they tend to minimize distributions, which will drive down your post-tax returns. ETFs are listed on stock exchanges and can be bought and sold like any other company share.
Product Innovations
Innovation is the key to success. For now, at least, all ETFs are an index fund which mirrors an index or a benchmark, unlike actively managed funds whose managers try to beat the market. There have been talk of companies bringing out actively managed ETFs, but so at least in India, it has not been manufactured. Currently, in India, the underlying for ETFs are Index, Sector, Money Market Instruments, Arbitrage etc. One more type to add in the basket of innovated products is actively managed ETF – MOSt Shares M50 ETF, the first of its kind in India, launched by Motilal Oswal Mutual Fund.
Passively-managed ETFs follows its index and invest in the same proportion as of its index while actively-managed ETFs follow their own fundamentally defined rules.
July 2, 2010
MOSt Shares M50 – Is it another offer in the crowd?

Among the above captioned NFOs, all the NFOs were more or less similar to the existing plans offered by another fund houses; I found a unique offer by Motilal Oswal AMC with its maiden NFO MOSt Shares M50 ETF. Though the ETF concept is new in India and has not been well received by investors yet, ETFs are on high. Historically, it has grown exceptionally even in intermittent market. Let me give out in detail why MOSt Shares M50 ETF is unique and investors’ friendly.
Product Features
As claimed by Motilal Oswal Mutual Fund, MOSt Shares M50 ETF is India’s 1st fundamentally weighted ETF based on the S&P CNX Index (Nifty). Logically, it is the remixed version of Nifty 50. The fund house has created its own basket “MOSt 50 Basket”, intellectually owned by MOAMC and managed by India Index Services & Products Ltd. (IISL). The weights of stocks in MOSt 50 Basket will be decided by their pre-defined methodology based on stock’s fundamentals (ROE, Net Worth, Retained Earnings and Valuation).
The fund aims to generate investment returns with minimal costs and active investment style. With no entry and exit load, the investors get another opportunity in terms of liquidity. The fund manager will invest 95-100% of the money in MOSt 50 basket and the exposure to fixed income and money market instruments along with cash call will be restricted to 0-5% of the total money invested.
Investment Strategy
The fund has reworked the weights of stocks in Nifty based on its own defined fundamentals such as Return on Equity, Net Worth, Retained Earnings and Price. They have designed the capital allocation strategy of the MOSt 50 basket to reduce the risk associated with price volatility of individual constituents. The table 1 defines the basket classification of MOSt 50 Basket.
 So, some of the companies will be more dominant than others based on the current methodology.
 Back Testing
Should you buy?
As far as the ETF story is going on, it has been building up in India. People have started recognizing the importance of ETFs as fund managers have failed to outperform the benchmarks over a longer period. Moreover, this new ETFs, also called as active ETF scored over others and provide uniqueness in terms of simplicity and maximization of returns over a longer period.
June 22, 2010
Life Insurance – A Distant Dream for Indians
India, a home to 1.15 billion people and the world’s second largest population stands abysmally low in terms of social security and human needs measures. Since independence, the Government of India introduced many measures to improve the economic conditions of this country. This included various social security schemes, the prominent being ESIC and EPFO followed by some recent measures such as MGNREGA (Mahatma Gandhi National Rural Employment Guarantee Act), National Rural Health Mission etc. The history of Insurance in India dates back to British colonial period, early 19th century. Since then, a lot of reforms came in existence, particularly for Life Insurance. Despite all measures, the penetration of Insurance is still ranked the lowest amongst other countries.
India is an under-insured country and the insurance penetration level stands abysmally low at 2 per cent of the population, the general insurance penetration stands at 0.6 per cent only. With a vast population of 1.15 billion, there is an immense opportunity that needs to be tapped. An estimated 80 per cent of the Indian population is without Life, Non-Life and Health insurance. However, the Indian Insurance industry is poised to grow robustly with a clear path set along the growth trajectory. In terms of total business, the Indian Life Insurance industry has grown from US $ 8.87 billion in Fiscal Year 2005-06 to US $ 41 billion as on Jan 2010, thus, giving an absolute increase of 362 per cent. In an average, the industry has been growing at a rapid pace of 30 – 34 per cent annually, as per Life Insurance Council. LIC, being the earliest player and set up under the Life Insurance Act in 1956 has played a dominant role in spreading its wings across all nooks and corner of India. However, the entry of private insurance players changed the dynamics of Indian Insurance industry.
As regard to the FDI being capped to 26 per cent in Life Insurance, it created an additional opportunity for foreign players who have been looking to tap the untapped insurance potential in India. The total FDI being routed to India under FDI to Insurance is US $ 525.6 billion. The government is keen to reintroduce the Insurance Bill which proposes to increase the FDI level to 49 per cent from the current level of 26 per cent.
But the question arises, why India is still tagged as Under Insurance industry? Have the government not done enough to increase the penetration level to all corners of India?
Why Insurance is sold in India?
Insurance policies are sold in India unlike its developed counterparts where it is sought after. No doubt, the major reason is poverty and low level of penetration in rural areas. The major population which is largely based in rural areas has low level of financial knowledge. Since, majority of India’s population is living below the poverty level (BPL), they are more interested in living their livelihoods instead of protecting their futures against any mishaps. Moreover, the Government of India does not run any social security schemes on its own unlike in other developed countries which contribute on their behalf. The lack of a proper path hampers the penetration level in insurance. One of the tools to measure the insurance development is per capital spending on insurance i.e. insurance density. Based on this measure, India ranks among the lowest spending nations in Asia in respect of purchasing insurance. Another factor that has been slowing the improvement of insurance density in India is its relatively high population growth rate.
The low income level (average per capital income being at Rs. 44,345 in 2009-10) also deters individuals to ask for insurance as a product to safeguard their futures. Moreover, insurance is not compulsory in India except Motor Third Party Liability. There is no other compulsory insurance in India. In a nut shell, the awareness is poor because insurance was not sold for years – it was bought. However, the mushrooming of private insurers has helped in a big way to push insurance products. Apart from the usual agent-client relationships, these insurers have been using new innovative measures such as Direct Marketing, Digital Marketing etc. Since Mobile has reached deeply in every nook and corner of India, insurers have been using it in a big way to push products.
What the government has done to boost Insurance in India?
• FDI up to 26 per cent permitted under the automatic route subject to obtaining a license from the Insurance Regulatory Development Authority (IRDA)
• Private insurance players have been allowed into the Insurance business; earlier it was dominated by LIC
• Set up of Insurance Regulatory Development Authority (IRDA) to regulate the insurance industry
• Set up of Foreign Players in conjugation with the domestic players
• Defining new rural business commitments in terms of number of life insurance policies sold and total premium collected, thus, asking allowing life insurance companies to set up their shops in rural and untapped areas
Entry of Private Players in Insurance Business
After the Government of India (GoI) liberalized the insurance sector in March 2000 with the passage of the Insurance and Regulatory Development Authority (IRDA) bill, it allowed the setting up of private and foreign insurance players in 2000. As a result, the total number of Life Insurers increased to 23 as of April 2010, as per IRDA report. The private players in partnership with foreign players brought new dimensions in the industry along with technological know-how, thus, reducing the operational costs and bringing new efficiency in the industry. The scaling up of private insurers reduced the market share of LIC India which forced them to overhaul their set up and its way of functioning. Entry of private insurance players brought alternative distribution channels to suit customers’ needs. So, the industry has moved from the typical meeting between the customer and insurance agent as seen earlier to new technology. New companies are emphasizing on speed, convenience and ease of transactions. Though there have been some mis-selling being reported, it is the regulatory loopholes which they have been exploiting and in the time to come, it will disappear gradually. IRDA has announced a series of regulations to regulate the insurance industry and also improved the solvency ratio, a measure to test the robustness and strength of Insurance Company. The insurance sector is set to witness a sea change in the way the businesses were traditionally done, with new innovative products, distribution network etc. Insurance players have also been experimenting direct marketing plans and have been successful too, to some extent.
Scope of Private Insurers in future
The future looks promising for Indian insurance industry. The private players have reached to untapped area. In some products like annuity or pension products business, the private insurers have covered a significant portion of the total market share. The most popular product Unit Linked Insurance Product (ULIP), locked in the spat of two regulators i.e. IRDA and SEBI have gained significantly, thus, creating a virtual monopoly in terms of over 90 per cent of the new customers. The government also moved and set up Micro Insurance Act to allow insurance companies to roll out Micro Insurance products suited for low income level population. With increased consumption power and overspending in rural areas, these rural folks are going to be the major customers for the economy. Moreover, the government is committed to improve its economic figures and it is bound to happen if it improves the social security conditions in rural areas in terms of Micro Insurance policies.
The Road Ahead
The saturation of insurance markets in various developed economies has made India an attractive market for foreign players. As per a report “Booming Insurance Market in India (2008-2011)”, the life insurance premium in India is projected to grow US $ 266 billion by 2010-11. The main objective is to make the participants familiar with the role of insurance in economic development.
May 31, 2010
Liquidity tightened on 3G outflows; RBI introduced ad-hoc liquidity measures
Highlights:
• Bonds take a break from a continuous 5 week rally; the benchmark bond 6.35% 2020 yield moved to 7.55%, up by 18 bps
• Domestic bond market mirrored US Govt. Bonds; US Treasury bonds’ yields rallied on account of poor consumer spending data
• Liquidity took a major hit; the 3G payments coupled with advance tax outflows put a strain on liquidity
• The RBI announced two liquidity easing measures – additional liquidity support up to 0.5% of banks’ NDTL and 2nd LAF (SLAF) on daily basis
• Call rates and inter-bank rates are likely to go up this week
View & Recommendation:
• With yields easing, fund managers have started increasing the average maturity of income funds, thereby, increasing their ranks in terms of returns.
• Investors looking for investments for a shorter period (6 months - 1 year) should invest in Ultra Short Term Funds (erstwhile called as Liquid Plus Funds) while those looking for a longer investment horizon (1.5 - 3 years) should invest in Income Funds.
• Some of the recommended Income Funds are Birla Sun Life Dynamic Bond Fund, ICICI Prudential Income Fund and Kotak Bond Regular Plan.
Broader Perspectives:
Bond Front
Indian bond markets took a break from a 5-week rally mirroring the movements in US Treasury yields and also incorporating the domestic factors such as liquidity crisis. However, the cancellation of weekly auctions looks distant as the government has other payment commitments such as Cash Management Bills worth Rs. 20,000 Cr, Bond maturities worth Rs. 50,000 Cr in July, cut in Treasury Bills auction size limited to Rs. 22,000 Cr along with government funding to Oil Marketing Companies (OMCs) to the tune of Rs. 14,000 Cr.
Earlier, last week, the bonds rallied after an announcement of probable cancellation of bond auctions this week due to liquidity squeeze arising out of 3G outflows and advance tax payments. The 3G outflows alone is sucking liquidity to an extent of Rs. 67,719 Cr.
The 10-year Benchmark Bond 6.35 per cent 2020 yield shot to 7.55 per cent, up by 18 bps over its last week close. The other heavily traded bond 8.20 per cent 2022 saw yields rise by 17bps to 7.80 per cent on weak-on-weak basis. The average trading volume for G-Secs as reported in NDS-OM platform was Rs. 19,985 Cr. Last week, there were 4 trading days only as the banks were closed on Thrusday (May 27, 2010).
Bond Supply
The government auctioned bonds worth Rs. 12,000 Cr. The notified auction amount was Rs. 4,000 Cr, Rs. 5,000 Cr and Rs. 3,000 Cr for 7.38% G-Sec 2015, 7.80% G-Sec 2020 and 8.32% G-Sec 2032 respectively. The bid to cover ratio was highest (2.5 times) in 10-year benchmark paper, the highest traded paper. The cut-off came in at 7.41 per cent, 7.60 per cent and 8.25 per cent respectively. The government will buyback Cash Management Bills worth Rs. 20,000 Cr this week.
Liquidity Desk
The liquidity was tight last week on account of 3G auction payments by Telecom Companies. Moreover, the advance tax outflows as expected on June 15 have also started putting strain on Liquidity. To ease the pressure, the RBI announced special measures to provide liquidity in the system. The RBI allowed banks additional support under the liquidity adjustment facility. The Central Bank will conduct two rounds of LAF operations. It also permitted banks to avail support of up to 0.5 per cent of their Net Demand and Time Liabilities (NDTL), the steps which will provide an additional liquidity support of Rs. 20,000 Cr. Both the measures would be applicable till July 02, 2010
Corporate Desk
Corporate bond yields hardened across the tenors. The AAA, 10-year paper hardened to 8.67% compared to 8.60% compared to last week. The 1-year bond traded at a yield of 6.65 per cent. This week, corporate bonds’ yields rose less than the government bond yields. The ten-year benchmark AAA spread shrank to 96bps, down by 14 bps. Corporate bond yields are likely to move higher on account of liquidity worries and interest rate spikes.
May 26, 2010
Yields softened on robust 3G collections and global cues
Highlights:
• Bond yields rallied for the fifth week straight; 10-year benchmark bond 7.80% 2020 settled at 7.37%
• Euro zone crisis continues to led to flight to safety; funds flowing in to US
• 3G auctions fetched Rs. 67,719 crore to government exchequer, much higher than the government expectation of Rs. 35,000 crore; Broadband wireless auction to fetch another Rs. 15,000 crore too
• The 1-10 year YTM spreads decreased by 21 bps to 254 bps
• Government resorted to 28-day Cash Management Bills again over and above its scheduled weekly auction showing that government’s finances are still under pressure
 View & Recommendation:
• G-Sec markets are likely to take cues from policy maker statements and will closely watch the Euro Zone for any developments.
• Markets at shorter end of the curve are expected to take cues from liquidity in the system as 3G outflows might put pressure on short term rates.
• The front end of Corporate Bond curve (1 – 5 years) seems to more attractive compared to overnight rates.
Broader Perspectives:
Bond Front
Indian bond markets rallied for the fifth week straight mirroring the US Treasury yields and also on account of positive cues from the domestic market. Higher than expected 3G auctions collection to the tune of Rs. 67,719 Cr along with comments from RBI Governor and Planning Commission Deputy Chairman that the government may cut down its borrowing in FY 2010-11 aided the rally in bond prices. Moreover, European Debt Crisis including ban on naked Short Selling on selective instruments by Germany led to flight to safety, triggering down the US, UK yields. US Treasury yields also fell due to higher than expected unemployment rate. On the last day of week, the 10-year benchmark bond 7.80 % 2020 settled at 7.37 per cent, a fall of 12 bps against last week close of 7.49 per cent. It touched its weekly low of 7.32 per cent. Global risk appetite battered after Germany banned naked short-selling on selective Euro Zone bonds, triggering fears that there may be more trouble from the region in the days to come.
Inflation Front
On the economy front, the inflation continues to worry government with both its indicative tools i.e. Wholesale Price Index (WPI) and Consumer Price Index (CPI) at double digit level. However, Planning Commission Deputy Chairman asserted that India’s Inflation as measured by WPI may fall further in coming 2-3 months. The market is expecting that the softening of yields including softened inflation numbers in coming months may prompt RBI to stall its exit from accommodative monetary policy. Earlier, the RBI has indicated that they will continue to exit from accommodative monetary measures on a regular basis in the face of demand led pressure on inflation. India’s annual inflation rate based on CPI for Rural Labourers fell to 14.96 per cent in April from 15.52 per cent in March. Primary articles inflation also cooled down to 16.19 per cent in the week ended May 08 from 16.76 per cent a week earlier, however, the food articles inflation jumped to 16.49 per cent from 16.44 per cent in the previous week.
Bonds Supply
The government auctioned bonds worth Rs. 13,000 Cr which were subscribed fully with no devolvement to Primary Dealers. The auctioned bonds were 7.02% 2016, 8.20% 2022 and 8.26% 2027 for amounts of Rs. 5,000 Cr, Rs. 5,000 Cr and Rs. 3,000 Cr respectively. The cut-off yields came in at 7.29 per cent, 7.64 per cent and 7.97 per cent respectively. The bid to cover ratio in 8.26% 2027 were around 2.5 times while remaining bonds witnessed subscribing little below 2 times. Moreover, the auctions of these relative liquid bonds added an increasing interest among dealers and buyers. The government also issued 28-day Cash Management Bills (CMB) at an average yield of 3.9225 per cent.
Liquidity Front
Liquidity as measured by bids for reverse repo/repo in Liquidity Adjustment Facility (LAF) remained comfortable. The reverse repo bids averaged Rs. 42,779 Cr from Rs. 28,749 Cr in the previous week. The liquidity may be under strain following the FIIs outflows in term of Portfolio Outflows and payouts for 3G auction bids. The average call rates and repo rates softened to 3.72 per cent and 3.40 per cent from 3.79 per cent and 3.47 per cent a week earlier respectively.
Corporate Bonds Front
Corporate Bonds saw spread closing up. Five and Ten year’s benchmark AAA spreads closed up by 3 bps at 80bps and 109 bps levels respectively. The ten year AAA bond traded at a yield of around 8.60 per cent, lower from 8.68 per cent observed last week.
• Bond yields rallied for the fifth week straight; 10-year benchmark bond 7.80% 2020 settled at 7.37%
• Euro zone crisis continues to led to flight to safety; funds flowing in to US
• 3G auctions fetched Rs. 67,719 crore to government exchequer, much higher than the government expectation of Rs. 35,000 crore; Broadband wireless auction to fetch another Rs. 15,000 crore too
• Comment from a Senior Finance Ministry official that approval of hike in ceiling on FII’s investment in Sovereign Bonds cheered the bond market during the week
• Liquidity remained comfortable; stood at a daily average level of Rs. 42,779 Cr against Rs. 28,749 Cr reported last week
• The 1-10 year YTM spreads decreased by 21 bps to 254 bps
• Government resorted to 28-day Cash Management Bills again over and above its scheduled weekly auction showing that government’s finances are still under pressure

• G-Sec markets are likely to take cues from policy maker statements and will closely watch the Euro Zone for any developments.
• Markets at shorter end of the curve are expected to take cues from liquidity in the system as 3G outflows might put pressure on short term rates.
• The front end of Corporate Bond curve (1 – 5 years) seems to more attractive compared to overnight rates.
Broader Perspectives:
Bond Front
Indian bond markets rallied for the fifth week straight mirroring the US Treasury yields and also on account of positive cues from the domestic market. Higher than expected 3G auctions collection to the tune of Rs. 67,719 Cr along with comments from RBI Governor and Planning Commission Deputy Chairman that the government may cut down its borrowing in FY 2010-11 aided the rally in bond prices. Moreover, European Debt Crisis including ban on naked Short Selling on selective instruments by Germany led to flight to safety, triggering down the US, UK yields. US Treasury yields also fell due to higher than expected unemployment rate. On the last day of week, the 10-year benchmark bond 7.80 % 2020 settled at 7.37 per cent, a fall of 12 bps against last week close of 7.49 per cent. It touched its weekly low of 7.32 per cent. Global risk appetite battered after Germany banned naked short-selling on selective Euro Zone bonds, triggering fears that there may be more trouble from the region in the days to come.
Inflation Front
On the economy front, the inflation continues to worry government with both its indicative tools i.e. Wholesale Price Index (WPI) and Consumer Price Index (CPI) at double digit level. However, Planning Commission Deputy Chairman asserted that India’s Inflation as measured by WPI may fall further in coming 2-3 months. The market is expecting that the softening of yields including softened inflation numbers in coming months may prompt RBI to stall its exit from accommodative monetary policy. Earlier, the RBI has indicated that they will continue to exit from accommodative monetary measures on a regular basis in the face of demand led pressure on inflation. India’s annual inflation rate based on CPI for Rural Labourers fell to 14.96 per cent in April from 15.52 per cent in March. Primary articles inflation also cooled down to 16.19 per cent in the week ended May 08 from 16.76 per cent a week earlier, however, the food articles inflation jumped to 16.49 per cent from 16.44 per cent in the previous week.
Bonds Supply
The government auctioned bonds worth Rs. 13,000 Cr which were subscribed fully with no devolvement to Primary Dealers. The auctioned bonds were 7.02% 2016, 8.20% 2022 and 8.26% 2027 for amounts of Rs. 5,000 Cr, Rs. 5,000 Cr and Rs. 3,000 Cr respectively. The cut-off yields came in at 7.29 per cent, 7.64 per cent and 7.97 per cent respectively. The bid to cover ratio in 8.26% 2027 were around 2.5 times while remaining bonds witnessed subscribing little below 2 times. Moreover, the auctions of these relative liquid bonds added an increasing interest among dealers and buyers. The government also issued 28-day Cash Management Bills (CMB) at an average yield of 3.9225 per cent.
Liquidity Front
Liquidity as measured by bids for reverse repo/repo in Liquidity Adjustment Facility (LAF) remained comfortable. The reverse repo bids averaged Rs. 42,779 Cr from Rs. 28,749 Cr in the previous week. The liquidity may be under strain following the FIIs outflows in term of Portfolio Outflows and payouts for 3G auction bids. The average call rates and repo rates softened to 3.72 per cent and 3.40 per cent from 3.79 per cent and 3.47 per cent a week earlier respectively.
Corporate Bonds Front
Corporate Bonds saw spread closing up. Five and Ten year’s benchmark AAA spreads closed up by 3 bps at 80bps and 109 bps levels respectively. The ten year AAA bond traded at a yield of around 8.60 per cent, lower from 8.68 per cent observed last week.
May 18, 2010
Domestic bond yields take cues from US, UK
Highlights:
• Ten year benchmark bond 7.80 per cent 2020 closed at 7.49 per cent touching its Dec figures, down by 15 bps from 7.64 per cent reported last week
• US $ 1 trillion EURO and IMF rescue package to Euro-Zone failed to cheer the world market post announcement
• Flight to Safety witnessed where the money moved out of emerging markets and fled back to US, UK and Germany bonds; yields touched their six-month lows
• India’s headline inflation as measured by Wholesale Price index (WPI) eased to 9.59 per cent in April from 9.9 per cent a month ago
• Liquidity traded at a daily average level of Rs. 28,749 crore
• Income category funds saw an inflow of Rs. 1,77,773 lakh crore in April as compare to an outflow of Rs. 1,64,487 crore as per the data released by AMFI
View &Recommendation:
• Bond yields continue to move down tracking the spurt in buying of US, UK and Germany bonds. The Euro crisis failed to settle down even after the announcement of a rescue package of US $ 1 trillion by other European Union and IMF. The shock waves sent by Euro zone are affecting the currency markets which may lead to a fall in EURO. Equity markets too fall in line with all major world indices going southwards.
• Looking forward, the lower end of the yield curve will continue to trade in range bound. However, in long term, the bond yields may witness upward revisions due to continuous supply of papers.
• The top recommended funds in Ultra Short Term category (erstwhile called as Liquid-Plus Funds) are IDFC Money Manager – Invest Plan – Plan A, HDFC Cash Management Fund – Treasury Advantage and Kotak Floater Fund while in Liquid Fund category, the recommended schemes are HDFC Cash Management Fund – Savings Plan and Reliance Liquidity Fund.
Broader Perspectives:
Though India’s headline inflation figure based on Wholesale Price Index (WPI) narrowed to 9.59 per cent in April from 9.90 per cent a month ago, the government continues to worry from the high figures. The Chief Economic Advisor says that Inflation will continue to fluctuate over the next three months before it starts falling steadily. The WPI topped the 10 per cent mark for the first time in 15 months in February. The higher than the expected inflation put upward pressure on yields. The Industrial Output data as measured by Index of Industrial Production (IIP) slid to 13.5 per cent in March against the market expectation of 15 per cent; manufacturing output grew 14.3 per cent in March compared with 16.1 per cent in February.
The benchmark bond 7.80 per cent 2020 yield dropped below 7.50 per cent level. It closed at 7.49 per cent touching its December figures, down by 15 bps from 7.64 per cent. The G-Sec spread of 10-5 years maturity bonds narrowed to 23 basis points from 27 bps a fortnight earlier. However, the 5-1 year spread widened to 214 bps from 165 bps reported last fortnight. G-Secs rallied following a fall in US Treasury yields, lower IIP and WPI figures. The most traded G-Sec 8.20 per cent 2022 saw yield falling to 7.74 per cent, down by 11 bps. The higher than the expected revenue from 3G auctions will help reducing the high borrowing program. The government is expected to raise Rs. 50,000 crore as against the expected figures of Rs. 35,000 crore. If 2G recommendations as suggested TRAI are implicated by the Telecom Ministry, the government will add additional revenue to its chest. The government issued Cash Management Bills of worth Rs. 6,000 crore at a cut-off yield of 3.87 per cent to pay off its bond redemptions.
The week saw an auction worth Rs. 12,000 crore of Government Securities namely 6.85% G-Sec 2012 (Re-issue), 6.35% G-Sec 2020 (Re-issue) and 8.26% G-Sec 2027 (Re-issue) for a notified amount of Rs. 5,000 crore, Rs. 5,000 crore and Rs. 2,000 crore respectively. All the securities were auctioned off successfully at cut-off yields of 7.24 per cent, 7.54 per cent and 8.22 per cent. There was no devolvement to Primary Dealers. However, the appetite among bond buyers seems to be dampened as the bid to cover ratio slipped below 2X despite a strong bond rally. The 10-year benchmark paper was subscribed to an extent of 1.58 times only. However, there was a strong demand on shorter tenure paper. The bond 6.85% 2012 was subscribed by around 3 times.
Liquidity as measured by bids for reverse repo/repo in the LAF (Liquidity Adjustment Facility) averaged Rs. 28,749 crore against last week average of Rs. 55,491 crore. Banks were also reluctant to lend to each other following weak credit sentiment in the market. The average Call and CBLO rate increased to 3.79 per cent and 3.68 per cent from 3.74 per cent and 3.32 per cent reported last week.
May 9, 2010
May 3, 2010
New benchmark yield 7.80% 2020 closed 5 bps down
New benchmark yield 7.80% 2020 closed 5 bps down
Highlights:
· Introduction of a new benchmark yield 7.80% 2020; yield cut-off at lower than the market expectation of 7.85%
· US Treasury yields traded down due to flight to safety after funds started moving out of emerging economies in lieu of Greece’s Fiscal woes
· Comfortable liquidity in the system; averaged Rs. 47,227 crore over the week
· Effective G-Sec borrowing to be little over Rs. 38,000 crore; bonds worth Rs. 26,876 is likely to retire this month
· Six year G-Sec 7.02% 2016 emerged as the most traded security with average volume of Rs. 5,482 crore
· Inflation based on Primary Articles moderated to 13.55 per cent against 14.14 per cent reported last week
View & Recommendation:
The sentiment is likely to be positive in bond markets; yields may move down further following surplus liquidity, positive MET forecast, low inflation (in weeks ahead), increased and improved inclination for government bond supply. Corporate bonds have seen their spread shrinking further due to increased FII’s buying interests and many other bond deals pipelined in the weeks ahead. Investors having investment horizon of 6 months to 1 year should invest in Ultra Short Term Funds. Once benchmark bond yields stabilizes at 8 to 8.25% levels, long term investors can consider shifting to Income Funds.
Broader Perspective:
Throughout the week, the benchmark G-Sec 6.35% 2020 lost its significance in the wake of announcement of new benchmark yield. It lost its liquidity and the six-year paper 7.02% 2016 emerged as the highest liquid paper with an average weekly volume of Rs. 5,482 crore. Last week, RBI conducted the auction of “7.38% 2015”, “8.28% 2032” and a new “Ten Year benchmark” for a notified amount of Rs. 5,000 crore, Rs. 2,000 crore and Rs. 5,000 crore respectively. The new 10-year benchmark paper received the highest bidding interest with bid to cover ratio of almost 4 times. The RBI fixed the cut-off yield at 7.80 per cent as against the market expectation of 7.85%. Soon after the yield fixation, the benchmark G-Sec slipped 5 bps and closed at 7.75% on account of bullish sentiments and easy liquidity. The bullish sentiment was further supported by a fall in US Treasury Yields as funds moved out of emerging economies on account of Greece’s sovereign crisis leading to Flight to Safety. Standard & Poor has downgraded Greece’s credit rating to Junk and cut Portugal’s rating by two notches to A-minus. It also cut its ratings on Spain by one notch to AA from AA-plus.
This week, the RBI is going to borrow Rs. 15,000 crore. Moreover, the government will also require paying to Oil Marketing Companies (OMCs) for making up the losses out of subsidies borne out by them. Though the government has expected to raise more than the budgeted Rs. 35,000 crore, the government’s financial strain is continue to worry.
RBI Governor D Subbarao said that high inflation was a big worry for the economy and the central bank would take calibrated approach in unwinding the accommodative measures. He also acknowledged that there could be crowding out of the private sector’s credit needs. Further, Deputy Governor Dr. K C Chakrabarty commented that RBI had not issued an extension to all banks to achieve 70% provision cover and would treat banks’ request on case-to-case basis.
On the liquidity front, the liquidity as measured by bids for reverse repo/repo under LAF (Liquidity Adjustment Facility) averaged Rs. 47,227 crore last week. The average CBLO rates spooked to 3.56 per cent from 2.99 per cent reported last week; however, the average CBLO volume declined to Rs. 47,445 crore from Rs. 51,112 crore reported last week.
Corporate bonds saw yields moving down last week. The 5- and 10-year corporate bond closed at 8.20 per cent and 8.70 per cent. However, the spread over G-Sec moved up by 13bps and 24 bps in 5- and 10- year corporate bonds respectively.
April 28, 2010
RBI’s ‘baby steps’ instead of ‘big leap’ favoured the bond market
Highlights:
• RBI announced policy rate hikes; Repo, Reverse Repo and CRR hiked to 5.25 per cent, 3.75 per cent and 6 per cent respectively, up by 25 bps
• RBI followed “baby steps” instead of “big leap” as a part of unwinding accommodative measures
• RBI’s M3 growth, Deposit Growth and Credit off-take projected at 17 per cent, 18 per cent and 20 per cent respectively for Fiscal Year 2010-11
• CRR hike of 25 bps drained out Rs. 12,500 crore from the system; liquidity still abundant with weekly average of above Rs. 48,000 crore
• Bond Markets reacted positively to RBI announcements; Yields moved down. Benchmark G-Sec 6.35% 2020 settled at 8.06 per cent or Rs. 88.64; Introduction of new security G-Sec 8.20% 2022
• Bond Markets remained buoyant throughout the week following the RBI’s announcement of policy rate hikes.
• Inflationary pressures (food including non-food) and overseas cues such as US Treasury Yields and Crude Oil Prices may also influence domestic bond yields
View & Recommendation:
The policy rate hike is unlikely to put any large impact on short-term yields due to abundance liquidity in the system. The high steepness at the shorter end (1-5 years) of the yield curve may prompt fund managers to roll-down the yields to generate extra returns provided the yield curve does not move significantly. Liquid Funds and Ultra-Short Term Bond Funds will continue to be preferred for investors having investment horizon of 1-3 months and 3-9 months respectively. Investors should avoid investing in high average maturity funds and should restrict investments to funds having average maturity up to 1 year. Short Term Income Fund will fill the void in this category.
Broader Perspective:
The bond markets reacted positively at RBI’s Annual Policy for Fiscal Year 2010-11. The RBI’s calibrated approach in exiting accommodative measures announced during the crisis period of 2008 and early 2009 was welcomed by traders as RBI announced 25 bps hike each in CRR, Repo Rate and Reverse Repo Rate, lower than the market expectations of 50bps. The RBI seemed more concerned on Inflation front and accordingly shifted its actions to inflation-led, thus, giving a balanced approach to Growth-Inflation dynamics. However, the markets could not cheer for the later part of the week and yields moved northwards across the curve in the following days. High Inflation pressure, large week-on-week gilts supply including overseas cues such as US Treasury Yields and Crude Oil Prices has continued to weigh on the gilt prices. However, the better-than-expected 3G auction sentiments (The government hopes to collect Rs. 50,000 crore than its expectation of Rs. 35,000 crore), positive MET forecast of normal monsoons and lower than expected net borrowings (Rs. 25,000 crore net of redemptions) in the month of May can keep the sentiments positive.
During the week, the benchmark G-Sec 6.35% 2020 lost its significance and reported very thin volume as it got replaced by G-Sec 8.20% 2022 amid expectations that the RBI will announce a new benchmark next month. The 10-year 6.35% 2020 and 8.20% 2022 yields moved down. While the benchmark yield settled at 8.06 per cent, 2 bps less than the previous week close, the new G-Sec 8.20% 2022 lost 16 bps since its inception. Traders feared that 6.35% 2020 supply would either shrink or stop and volume shifted to G-Sec 8.20% 2022. Apart from this, the RBI successfully auctioned bonds worth Rs. 12,000 crore – the 7.02% 2016 for Rs. 6,000 crore, the 8.26% 2027 for Rs. 3,000 crore and the 2020 Floating Rate Bond for Rs. 3,000 crore. The RBI sold its first floating rate bond in this fiscal year 2010-11. Floating rate bonds are preferred by investors as the coupon is adjusted every six months, allowing to avoid booking nominal losses in their books. The RBI also announced that it would announce auction results of gilts on the following Monday of auction week instead of Friday of same week.
Liquidity as measured by bids for reverse repo/repo under Liquidity Adjustment Facility was comfortable with bids averaging Rs. 48,738 crore. The coming week may see a slight contraction in liquidity following Rs. 12,500 being drained out as a part of hike of CRR.
Corporate bonds also saw its credit spreads shrinking. Five- and Ten-year spreads dropped by 18 bps and 10 bps to 52 bps and 53 bps respectively. The 10-year AAA Corporate Bond yield closed at 8.75 per cent, a loss of 12 bps.
April 16, 2010
MF Industry saw a dip of Rs. 1.53 lakh cr; Equity also saw outflows
Indian Mutual Fund industry suffered a major jolt at the concluding month of fiscal year 2009-10. The Asset Under Management (AUM) for the month of March stands at Rs. 6,13,979 crore, a loss of Rs. 1,52,890 crore or 19.94 per cent over its last month figures. The industry saw a net outflow of Rs. 1,52,890 crore against a gain of Rs. 6,365 in the month of Feb. The Income category saw a maximum outflow of Rs. 1,64,487 crore or a loss of 34.57 per cent. Last month, this category had seen a net inflow of Rs. 4,887 crore. However, the Liquid/Money Market category has shown an improvement over its last month figures. The current month saw a net inflow of Rs. 3,971 crore. In Income Fund category, there have been net outflow as the banks have redeemed their investments from Mutual Funds following strict directives from RBI and SEBI. The major surge in Mutual Fund Industry AUM has been happening due to increased participation from banks. They have been keeping their surplus money with Mutual Funds as the credit off-take has been slow following the bleak economic. However, in the month of March, banks have reduced their Mutual Fund positions from Rs. 1,09,453 crore as on Feb 26, 2010 to Rs. 55,502 crore as on Mar 2010. In March 2009, the banks have total investments of Rs. 36,781 crore in instruments issued by Mutual Funds. Last year in Dec 2009, RBI issued a directive to all banks after banks increased their total investments in Mutual Funds to Rs. 1,69,236 crore. RBI argued that the money invested in Mutual Funds have been revolving in the system in the form of Certificate of Deposits (CDs) which banks have been placing with Mutual Funds. The category added three new income fund schemes. JP Morgan India Short Term Income Fund and Sundaram BNP Paribas Monthly Income Plan – Conservative & Aggressive were new schemes added.
On the other front, the Equity category AUM rose to Rs. 1,74,054 crore in Mar 2010 in comparison to Rs. 1,68,672 crore recorded last month, up by 3.19 per cent. However, in terms of total flows, it saw a net outflow of Rs. 2,016 crore. In the month of March, Fund Managers booked profits seeing stretched valuations of stock market. Moreover, they also distributed dividends rampantly. SEBI also banned the dividend distribution out of Unit Premium Reserve (UPR). It said that the dividend distribution amount must be from the profits booked by the scheme. Since the ban of entry loads, equity category has seen a constant outflow of its assets. However, the first two months of 2010 had seen some inflows. In fiscal year 2009-10, the equity category has seen a net inflow of Rs. 595 crore only. However, the overall Mutual Fund AUM has grown 47.13 per cent in FY 2009-10. Bharti AXA Focussed Infrastructure collected Rs. 41 crore from its NFO.
The ELSS category saw its maximum inflow in last 15 months. The category added Rs. 641 crore to its kitty. The inflows had been mainly due to tax-season month where investors put their money in ELSS to get tax rebate under Sec 80C of Income Tax Act 1961. It saw a total inflow of Rs. 1,554 crore in last one year.
 The ETF category saw some major outflows in other ETFs category. While Gold ETF added Rs. 45 crore to its kitty, other ETFs category saw an outflow of Rs. 439 crore. Current the total AUM stands Rs. 957 crore, a loss of 28.69 per cent over its last month figures. Two ETFs were added to the category. Religare Gold ETF garnered Rs. 19 crore in its NFO period while Hang Seng Benchmark Exchange Traded Scheme added Rs. 55 crore from its NFO. Hang Seng ETF is the first international ETF being launched in India by Benchmark Mutual Fund.
Gilts saw a net inflow of Rs. 267 crore. Its AUM rose to Rs. 3,395 crore in the month of March 2010, a gain of 7.06 per cent over its last month figure. Given high borrowing programme, bond yields are poised to rise further. The category may saw some inflows in the months to come once the benchmark yield level reaches to 8.25 per cent to 8.5 per cent.
The industry also saw a herd of FMPs in the month of March 2010. A total of 69 schemes were launched which collectively garnered Rs. 14,642 crore. FMPs have seen a comeback after a brief lull. March sees the maximum numbers of new NFOs in FMP category as these products are launched mainly to avail the double indexation benefit, thus, minimizing the tax burden to investors on income earned.
On the other front, the Equity category AUM rose to Rs. 1,74,054 crore in Mar 2010 in comparison to Rs. 1,68,672 crore recorded last month, up by 3.19 per cent. However, in terms of total flows, it saw a net outflow of Rs. 2,016 crore. In the month of March, Fund Managers booked profits seeing stretched valuations of stock market. Moreover, they also distributed dividends rampantly. SEBI also banned the dividend distribution out of Unit Premium Reserve (UPR). It said that the dividend distribution amount must be from the profits booked by the scheme. Since the ban of entry loads, equity category has seen a constant outflow of its assets. However, the first two months of 2010 had seen some inflows. In fiscal year 2009-10, the equity category has seen a net inflow of Rs. 595 crore only. However, the overall Mutual Fund AUM has grown 47.13 per cent in FY 2009-10. Bharti AXA Focussed Infrastructure collected Rs. 41 crore from its NFO.
The ELSS category saw its maximum inflow in last 15 months. The category added Rs. 641 crore to its kitty. The inflows had been mainly due to tax-season month where investors put their money in ELSS to get tax rebate under Sec 80C of Income Tax Act 1961. It saw a total inflow of Rs. 1,554 crore in last one year.

Gilts saw a net inflow of Rs. 267 crore. Its AUM rose to Rs. 3,395 crore in the month of March 2010, a gain of 7.06 per cent over its last month figure. Given high borrowing programme, bond yields are poised to rise further. The category may saw some inflows in the months to come once the benchmark yield level reaches to 8.25 per cent to 8.5 per cent.
The industry also saw a herd of FMPs in the month of March 2010. A total of 69 schemes were launched which collectively garnered Rs. 14,642 crore. FMPs have seen a comeback after a brief lull. March sees the maximum numbers of new NFOs in FMP category as these products are launched mainly to avail the double indexation benefit, thus, minimizing the tax burden to investors on income earned.
April 13, 2010
Bond yields laddered to 8 per cent level on devolvement
Highlights
• Benchmark bond 6.35% 2020 yield touched to 8.01 per cent on account of devolvement* in first week auction
• Primary dealers had to devolve Rs. 448 Cr. of 6.35% 2020 paper
• Food inflation rose to 14.50 per cent for data on Mar 27, 2010 against 13.86 per cent observed a week before
• Limits for Ways and Mean Advance (WMA) set at Rs. 30,000 Cr. for first half of FY and Rs. 10,000 Cr. for second half of FY
• Inflationary pressures (data to be available next Thursday) and Industrial Output data to influence the policy review due on April 20, 2010; inflation likely to be in double digits
• Market to witness an auction of Rs. 13,000 Cr. on Government Securities and Rs. 5,800 crore of State Development Loans (SDL) this week
*Devolvement - is a mechanism used by Reserve Bank of India as part of its monetary policy to counter the volatility in the price of Government Securities. Under this mechanism Primary dealers would have to absorb the underwritten amount, when the bid prices are unacceptable to the RBI.
Views & Recommendation:
• The weekly bond issuances are likely to impact the bond prices in a greater way; any further devolvement will put pressure on bond yields.
• Liquid Funds and Ultra Short Term Funds (erstwhile called as Ultra Short Term Funds) would see its yields rising from the current yield as shorter end of yield curve is likely to move up in near future once the policy rates go up.
• Investors having longer investment horizon (more than 2 years) should wait for yields to reach to 8.25-8.5 per cent level and can then invest in Income Funds.
Broad Perspective:
The week started with a cooling in bond yields; the 10-year benchmark 6.35% 2020 G-Sec slipped to 7.80 per cent on Monday, down by 5 bps over its last week closing. However, the sentiments went against the market and the yields rose to its three week highs ahead of first week auction of Rs. 12,000 crore and monetary policy tightening to contain high inflation.
The auction results disappointed the market and the benchmark yield passed 8 per cent mark to close at 8.01 per cent on account of devolvement. It touched to 8.03 per cent level, its highest in more than 17 months and a level it touched on Mar 22, 2010. The auctioned bonds got timid response and primary dealers had to devolve Rs. 448 crore of 6.35% 2020 paper. RBI set the cut-off yield of 7.9645 per cent for the 6.35% 2020 bonds. The other bonds were fully subscribed amidst high demand. Both received demands for more than two times. Due to devolvement, primary dealers demanded high cut-off yields. This week, the choice of securities will decide the momentum of bond yields and primary dealers will demand higher underwriting fees and higher yields in fear of devolvement of securities. Moreover, the subdued response on 6.35% 2020 bond is putting pressure on its existence as the benchmark yield and traders have been demanding for a new benchmark so that they could concentrate on the movement on interest rates instead of choice of a benchmark bond.
Inflationary pressures continue to remain intact; food prices accelerated for second straight week. The inflation based on primary articles rose to 14.50 per cent for the week concluding on Mar 27, 2010 against 13.86 per cent observed a week before. Industrial output data for February due on Monday and March inflation data on next Thursday are the factors which will decide the direction of RBI Policy review due on April 20, 2010.
Liquidity as measured by bids for reverse repo/repo at the Liquidity Adjustment Facility auction went to an average level of Rs. 1 lakh crore against Rs. 2,000 crore reported last week. Overnight rates also remained at the level of reverse repo rates due to high liquidity in the system.
However, Corporate Bonds yields saw an increased activity in the trading circles. Its spread over its counterpart G-Sec slipped in all categories. The 5-year and 10-year corporate bond spread over its counterpart G-Sec slipped to 76 bps and 63 bps from 81 bps and 82 bps respectively. The 10-year Corporate Bond closed at 8.80 per cent for the week concluding on April 09, 2010.
RBI set the limit for Ways and Mean Advance (WMA) at Rs. 30,000 crore for first half of fiscal year (April to September) and Rs. 10,000 crore for second half of fiscal year (October to March). WMA is a window through which the government borrows from RBI to meet mismatches between payment and receipts. Any borrowing within the WMA limit is done at Repo rate and over the WMA limit, it is done at Repo plus 2 per cent.
April 8, 2010
MF Industry assets grew 51.6 per cent y-o-y
Highlights:
• Mutual Fund Industry assets grew 51.6 per cent on year-on-year basis; shrink by 4.6 per cent on month-on-month basis
• The AAUM touched Rs. 7.47 lakh crore as on Mar 2010; saw its historical high of Rs. 8.07 lakh crore in Nov 2009
• Reliance Mutual Fund (Rs. 1.1 lakh crore) continues to be the top fund house in terms of AUM
• SEBI dedicated fiscal year 2009-10 for investors bringing in many regulatory changes which changed the mutual fund industry trends
• Equity funds saw major outflows after the ban of entry loads
• Liquid Funds/Income Funds/Ultra Debt Short Term (erstwhile called as Liquid Plus Funds) will continue to see the inflows given the uneven interest rate scenario in near future
The fiscal year 2009-10 ended into a happy note with Mutual Fund Industry assets growing 51.6 per cent year-on-year. The industry added a total of Rs. 2.54 lakh crore to its kitty with total Average Assets under Management (AAUM) of Rs. 7.47 lakh crore. The year also saw Mutual Fund AUM’s historical peak of Rs. 8.07 lakh crore as on Nov 2009. However, it lagged the bellwether indices Sensex and Nifty 50 which clocked 80.54 per cent and 73.76 per cent returns respectively for the fiscal year 2009-10. On monthly basis, the Mutual Fund Industry Assets slipped to Rs. 7.47 lakh crore or a loss of 4.6 per cent over its Feb end of Rs. 7.82 lakh crore. The Feb month saw a hike of 2.64 per cent on monthly basis.
Reliance Mutual Fund continues to top the chart with AAUM of Rs. 1.10 lakh crore with a hefty gain of 36.4 per cent. The other leading fund houses in terms of AAUM are HDFC Mutual Fund (Rs. 88,780 crore), ICICI Prudential Mutual Fund (80,989 crore) and UTI Mutual Fund (Rs. 80,218 crore). On absolute basis, the fund houses which saw windfall gains are UTI Mutual Fund (Rs. 31,463.6 crore), HDFC Mutual Fund (Rs. 30,823.4 crore), ICICI Prudential Mutual Fund (29,556.3 crore) and Reliance Mutual Fund (Rs. 29,450 crore). The massive increase in AUM was mainly due to inflows in Debt/Income/Liquid/Liquid Plus categories. However, equity had a net outflow after SEBI banned entry loads post Aug 2009.
The fund houses which saw maximum decline on month-on-month basis are JP Morgan Mutual Fund (-31 per cent), AIG Global Investment Group Mutual Fund (-24.9 per cent), Deutsche Mutual Fund (-19.5 per cent) among others. The prominent gainers in double digits were Peerless Mutual Fund (60 per cent) and Edelweiss Mutual Fund (23.3 per cent).
April 6, 2010
Yields to reel under inflationary pressures; rate hikes imminent
Highlights:
- Government borrowing schedule of massive Rs. 4.57 lakh crore declared; 63 per cent of total borrowings are front-loaded in first half of fiscal year 2010-11.
- On an average, the weekly borrowing would be in the range of Rs. 11,000 to Rs. 13,000 crore; the May month may witness the maximum borrowing of Rs. 65,000 crore with minimal borrowing of Rs. 22,000 crore in September.
- No Open Market Operations (OMOs) transactions declared; unlikely to put any pressure on yields due to sufficient liquidity.
- The week saw a sudden yearend decline in bond yields following the borrowing schedule declaration; unlikely to sustain the spurt in bond prices.
- Inflationary pressures to continue putting pressures on bond yields.
- The 10-year benchmark G-Sec 6.35 % 2020 to trade in the range of 8-8.5 per cent for most of the year.
- There was a combined transaction of Rs. 9,540 crore under Repo Facility in the last 3 days of Fiscal Year 2009-10.
- The G-Sec spread between 1-5 years have widened to 238 bps from 227 bps in the previous week.
Views & Recommendation:
· For few weeks, the market may absorb the bond issuances without any impact on yields but in long term, the bond yields may witness upward revisions.
· The short-tenure bonds would be in demand in the month of April and May in the current fiscal year due to negligible issuances. This may lead to unexpected hike in prices of short to medium term papers. An opportunity lies ahead in booking profits in short-to-medium term bonds/Income Funds/Short Gilt Funds after a couple of months.
On return basis, Tata G S S M F – Growth (6.67%), UTI G Sec Fund – STP – Growth (5.06%) among others has been front runners under Short-term Gilt Funds in two-year category.
· Liquid Funds and Ultra-Short term Debt Funds (erstwhile called as Liquid-Plus Funds) will continue to see inflows as investors would continue putting their surpluses for a short duration.
Broader Perspective:
The market reacted positively on the announcement of Government Borrowing Schedule; about 63 per cent of total borrowings (Rs. 2.87 lakh crore) are front-loaded in the first half of fiscal year 2010-11. Thus, it would prevent crowding out for private firms as post-October used to be busy borrowing month for them. The market will see an average weekly auction of Rs. 11,000 – Rs. 13,000 crore. The benchmark bond 6.35 per cent 2010 yield saw some swings. The yield fell from 7.85 per cent to as low as 7.74 per cent before closing at 7.85 per cent level again. The 10-year benchmark G-Sec price closed at Rs. 89.90 down from Rs. 90.30 level as on Mar 30, 2010. Bond Prices and Yields move in opposite direction.
The high inflationary pressure is on the top agenda of policy makers as they are closely scrutinizing to negate its effects on yields since it would increase their borrowing costs. The inflation as measured by Wholesale Price Index (WPI) has already touched 9.89 per cent for the month of Feb 2010 and the March figures may touch the double digit. Though the government officials are of the view that inflation would drop down in couple of months citing the high base effect and falling food prices as the prominent reasons, it will continue haunting on non-food sides. The high crude prices including the high petrol and diesel prices for EURO IV vehicles will add pressures to inflation further.
The market may factor into the weekly bond supply and will see a smooth transition of bonds for first few weeks but the yields may harden in the weeks to come citing the absence of any Open Market Operations (OMOs) from the government side.
The other bonds 7.02% 2016 and 7.32% 2014 saw yields moving up 13 bps and 1 bps to 7.59 per cent and 7.25 per cent levels. Corporate bonds also saw yields dropping down. The shorter end of the curve saw yields falling piercingly after March-end liquidity worries went out of the system. The last three days of the fiscal year 2009-10 saw a total repo transaction of Rs. 9,540 crore under Liquidity Adjustment Facility (LAF). The liquidity as measured by Reverse Repo transaction under Liquidity Adjustment Facility (LAF) remained tight with an average volume of Rs. 4,027 crore.
April 1, 2010
New Mutual Fund regulations to benefit investors
The Mutual Fund Industry has a happy ending in 2009 with assets growing to a fabulous high. The industry also saw some investors’ friendly regulations turning to be unfriendly for distributors and IFAs. Starting from No-Load scenario post Aug 01, 2009 to host of other regulations, SEBI threw another set of regulations to all fund houses in the month of March 2010 signaling another round of reforms in world’s fastest growing Mutual Fund industry.
Reduction of NFO’s Period
Starting with the list, SEBI reduced the New Fund Offers (NFOs) duration to a maximum of 15 days from 30 days for open-ended funds and 45 days for close-ended funds. On completion of NFO period, the units’ allocation and dispatch of Statement of Accounts (SoAs) are required to be done within five business days after the closure of NFO period. The rule also says that Mutual Funds shall make investments out of NFO proceeds only on or after the closure of the NFO period. The new rule is effective from July 01, 2010.
Introduction of ASBA for MF Investors
SEBI introduced ASBA or Applications Supported by Blocked Amount in July 2008 for all equity investors investing in IPOs or Right Issues to make effective use of money put into it. Under this, the application money you put for subscribing to IPOs/Right Issues does not leave your bank account unless the allotment is done. So, there is no need for refund of money, thus, reducing the operational issues and you also earn interest even on blocked amount. Now, this facility is extended to Mutual Fund investors putting money in NFOs. Nevertheless ASBA means little for investors as most investors put money only on the last day of NFO period. Moreover, SEBI has mandated that the fund house has to allot units five days after the closing of NFOs.
Dividend distribution from realized profits
SEBI also mandated that the dividends to be paid to investors have to be out of realized profits only. Currently, some Mutual Fund houses pay dividends from their Unit Premium Reserve instead of booked profits. E.g. A fund XYZ has an initial NAV of Rs. 10. The amount Rs. 10 goes to an account called as Unit Capital or Face Value. Let us say the NAV grows to Rs. 15. The appreciation amount of Rs. 5 goes into a separate account called as Unit Premium Reserve (UPR). This ruling might affect many fund houses which used to declare dividends as a marketing gimmick to attract inflows. After this ruling, many fund houses have cancelled the dividends declared.
FoFs commission to decline
In case of FoFs, AMCs have been entering into revenue sharing agreements with offshore funds in respect of investments made. Typically they get around 50-100 bps from Offshore Funds along with 75 bps which they charge from investors. Out of 75 bps, they used to take care of marketing expense and other expenses. The Fund Houses used to pocket the sharing revenue (50-100 bps) from Offshore or Local Funds where they have invested. Post this ruling, an FoF may not be a profitable avenue for Mutual Funds in India.
Adherence to Corporate Governance
Since Mutual Funds invest in companies on behalf of investors, SEBI wants them to be more participating in company affairs and voice their opinions. SEBI has mandated that Mutual Funds must disclose participation in company’ annual or other affairs such as exercising voting rights in mergers, AGMs, changes to capital structure, appointment or removal of Directors, stock option plans and other management compensation issues and many more in their website and Annual Reports.
Following Satyam scam, SEBI wanted the companies to be more accountable for their acts and business rules and Mutual Funds which represent a group of investors will be the best fitted for this role.
Conclusion
Time to time, SEBI comes out with different regulations which ultimately helps retail investors. Thanks to our robust financial system which surpassed the economic crisis of 2008 post Lehman collapse, SEBI wants to ensure that India remains decoupled with financial breakdown which galloped major big names. Moreover, SEBI wants to make MF and its fund managers more transparent and accountable for investors’ money. However, the challenges lie ahead how the fund houses implement these changes. Happy Investing!
Subscribe to:
Posts (Atom)